
In our last series we took a look at Prometheus, its metric data types, and how it compares to the OpenTelemetry project. In this next series we’re going to do the same for Zipkin and OpenTelemetry traces.
Metrics are designed to count things, and to measure how long those things take to complete. A trace, and the individual parts of a trace (called spans — but don’t worry too much about that right now), also allow you to measure how long something took. Where traces differ from metrics is they also keep track of how these things you’re timing are related to one another.
That’s pretty abstract, right? So let’s zero in on a specific example to help clarify things. We’ll use Zipkin to generate and view traces from a small sample application.
This tutorial assumes you have a version of NodeJS installed on your computer, as well as a version of Docker.
Getting Started with Zipkin
Zipkin, like Prometheus, is many things. It’s a data model for traces, it’s libraries for instrumenting code, it’s the instrumentation libraries others have created, and it’s a java application. Right now we’re going to focus on the Zipkin application itself.
The Zipkin application is an open source piece of software implemented in Java. The README.md and website have instructions for getting started running the software.
We’re not particularly java inclined here at alanstorm dot com — it’s a fine language and kind of runs the world, but I don’t work in it daily and its toolchain can be fiddly. If you’re of a similar mindset, we’re going to recommend running Zipkin via Docker.
Someone that’s part of the Zipkin project maintains a Docker Hub image for Zipkin. This image makes it pretty easy to get a Zipkin instance up and running. Once you’ve installed Docker (if you’re not sure how, Docker for Desktop is the easiest way to get started), all you’ll need to do is run the following command.
$ docker run -d -p 9411:9411 openzipkin/zipkin
and you’ll have a Zipkin instance up and running. You’ll be able to load it by pointing your web browser to http://localhost:9411. You’ll see something like this

While it’s possible to run Zipkin on a different port this tutorial assumes you’re using port 9411.
If you want to stop your Zipkin instance, you can find its container ID by running docker ps
$ docker ps
CONTAINER ID        IMAGE               COMMAND                CREATED             STATUS              PORTS                              NAMES
4904971592de        openzipkin/zipkin   "/busybox/sh run.sh"   2 minutes ago       Up 2 minutes        9410/tcp, 0.0.0.0:9411->9411/tcp   jovial_bell
and then running docker stop (replacing 4904971592de with your container ID)
$ docker stop 4904971592de
Docker, while ultimately more complex than the systems it seeks to replace, is becoming increasingly hard to avoid. If there was an easier way for non-java developers to run Zipkin we’d point you towards it.
The Application
So we have Zipkin up and running. Next, we need something to trace. Let’s imagine three independent web services/APIs/urls. If you call the first URL, its handler needs to call a second URL to finish, and this second URL needs to, in turn, call a third url. If that’s hard to imagine, don’t worry. We’ve built a sample system for you. Head on over to the astorm/zipkin-example repository.
To run these three services in NodeJS, do the following
$ git clone https://github.com/astorm/zipkin-example
$ cd zipkin-example/uninstrumented
$ npm install
$ npm start
Once you’ve done the above, call the main endpoint to see it in action
$ curl localhost:3000/main
{"main":"hello world, goodbye world"}$
As we asked you to imagine, the code that handles this URL calls a second URL, which in turn calls a third.
We’re not going to dwell on the implementation details here. If the code in this example service is new to you (and it was new to all of us at some point), this Express web framework tutorial over at the Mozilla Developer Network is a good place to start learning what’s going on.
An Instrumented Application
With a running instance of Zipkin, and our “three-service application”, we’re ready to see what Zipkin is all about.
In order to have your application traced by Zipkin, you need to add instrumentation code to your application. This is similar to the instrumentation code we used for metrics back in our Prometheus series. Instrumenting for traces is slightly more complicated than instrumenting for metrics. Because of this, rather than run through adding the instrumentation to each of your services, we’ve prepared a separate version of the services, each already instrumented. Don’t worry — we’ll eventually cover how to instrument a service with Zipkin.
So, let’s start our new instrumented services. Navigate to the instrumented folder in the astorm/zipkin-example repository.
$ git clone https://github.com/astorm/zipkin-example
$ cd zipkin-example/instrumented
$ npm install
$ npm run start

> zipkin@1.0.0 start /private/tmp/working/zipkin-example/uninstrumented
> node src/index.js

Example app listening at http://localhost:3000
Example service listening at http://localhost:3001
Example service listening at http://localhost:3002
Then, in a second terminal window, let’s send some traffic to the main service.
$ curl http://localhost:3000/main
{"main":"hello world, goodbye world"}

$ curl http://localhost:3000/main
{"main":"hello world, goodbye world"}

$ curl http://localhost:3000/main
{"main":"hello world, goodbye world"}
Finally, let’s open up Zipkin and then use the UI to search for traces from the last five minutes
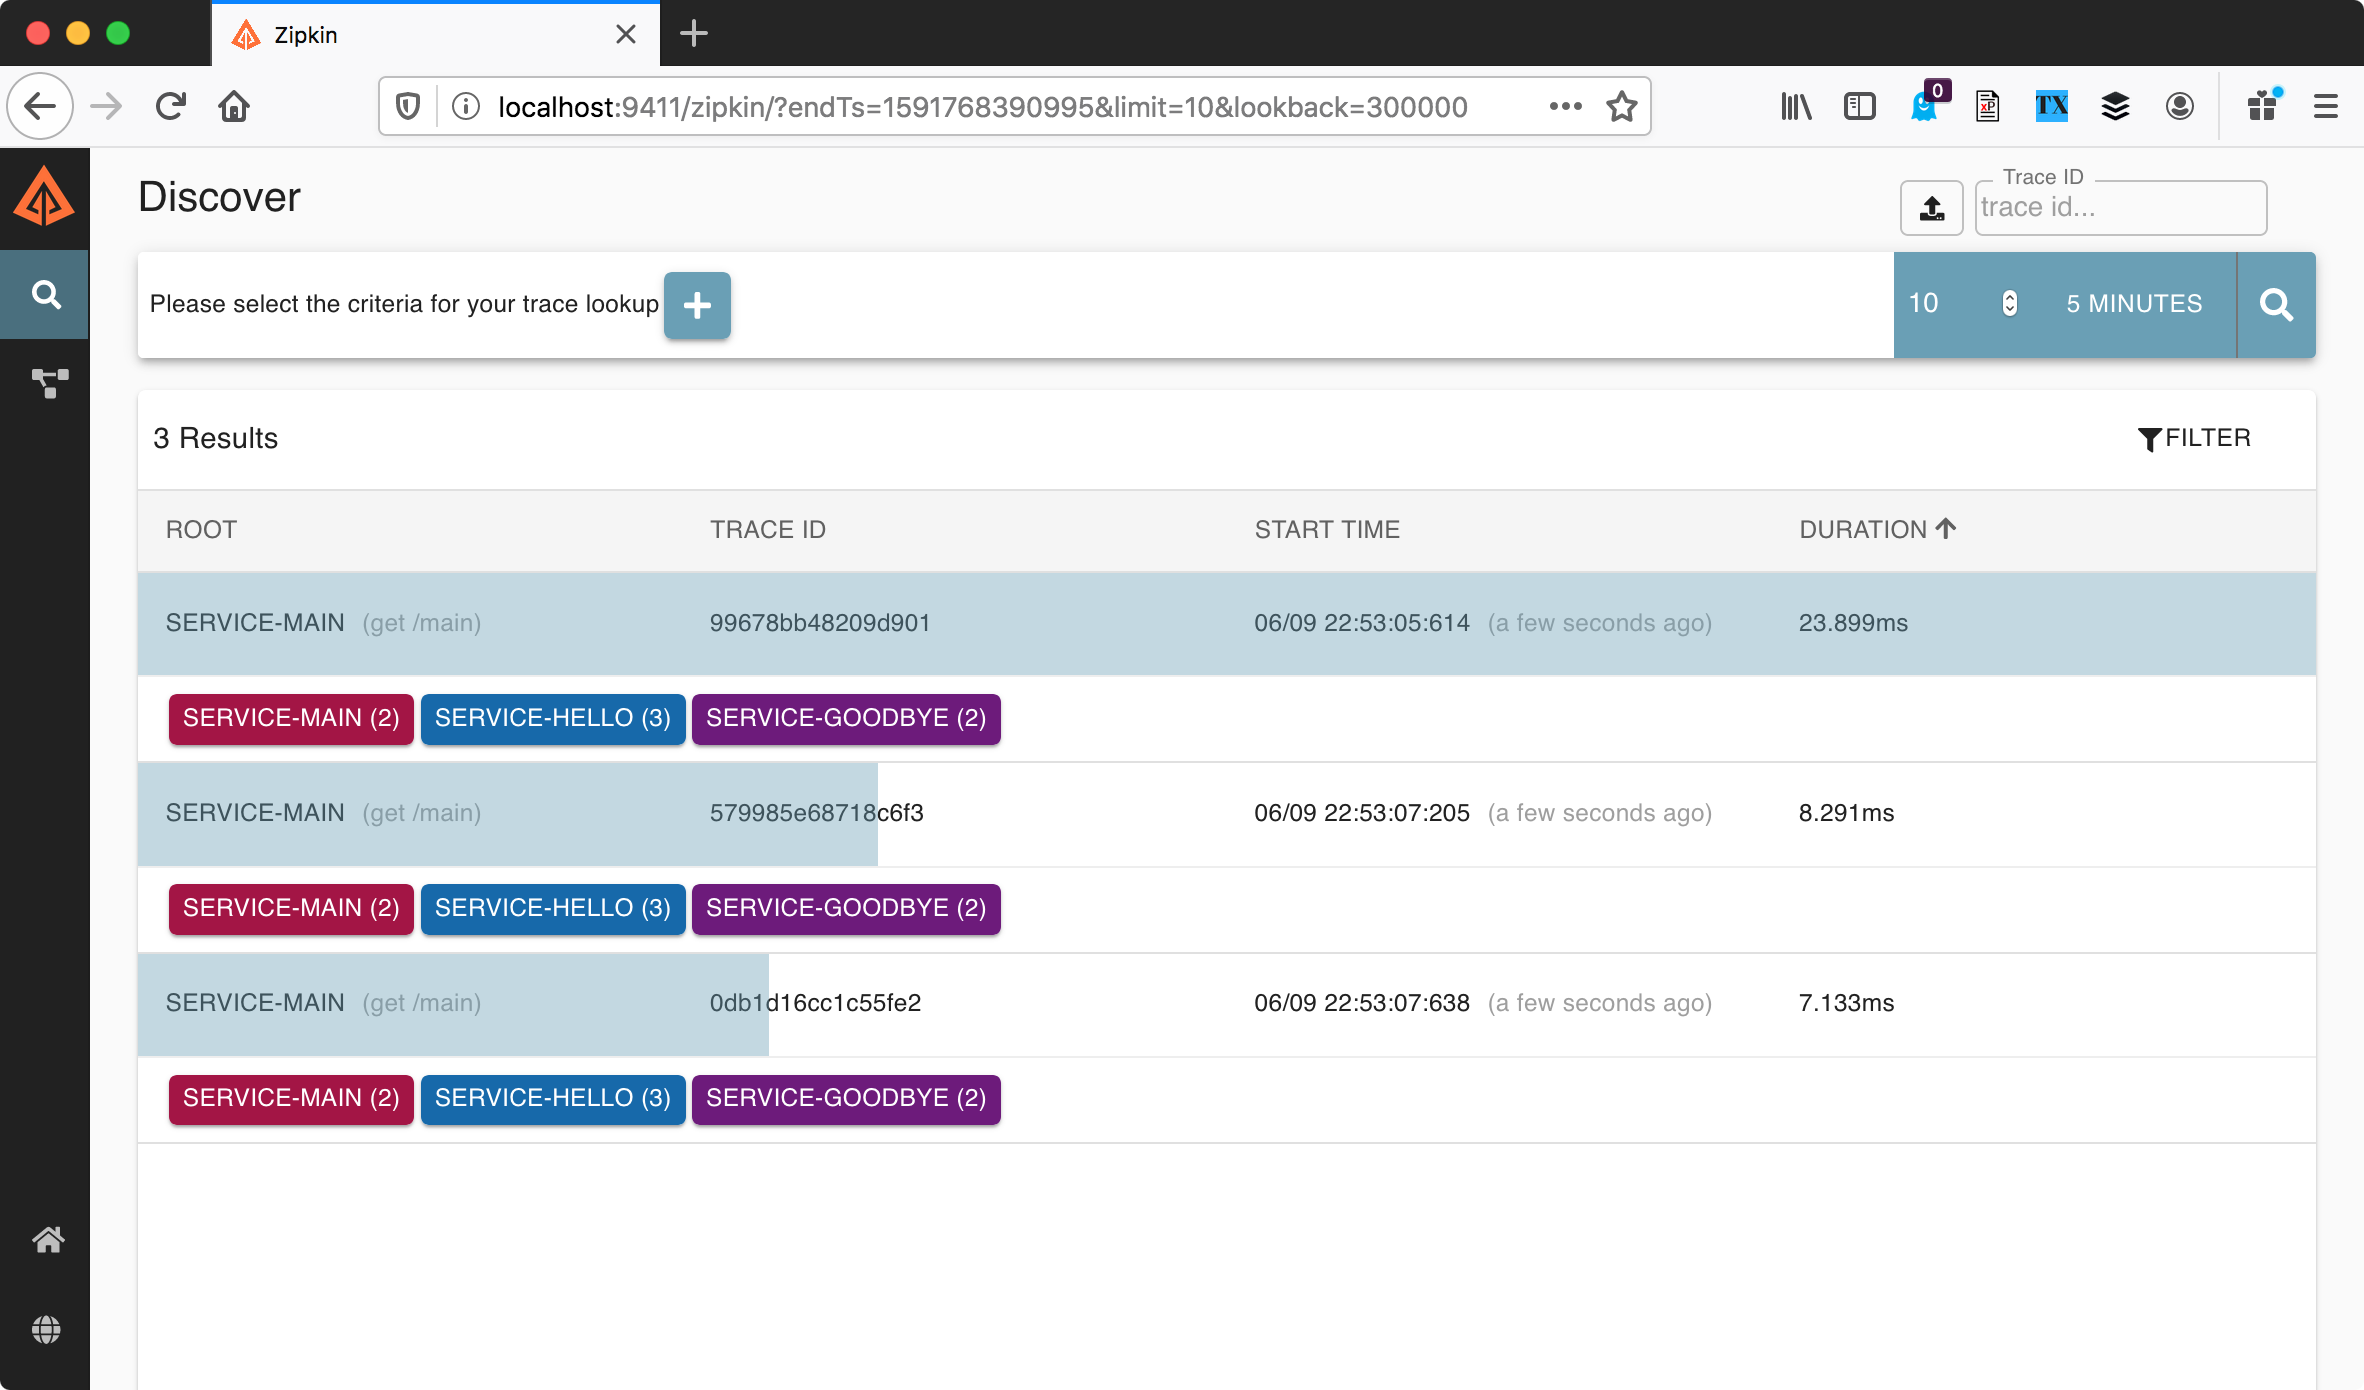
Ah ha! There’s our traces!
Zipkin Traces and Spans
So — what is a trace? If we look at this list of traces, we can see that, for each trace, Zipkin appears to be listing each service that an HTTP request passed through.
We see service-main, service-hello, and service-goodbye. Traces also have an ID, a start time, and a duration. If we click through to view the trace details
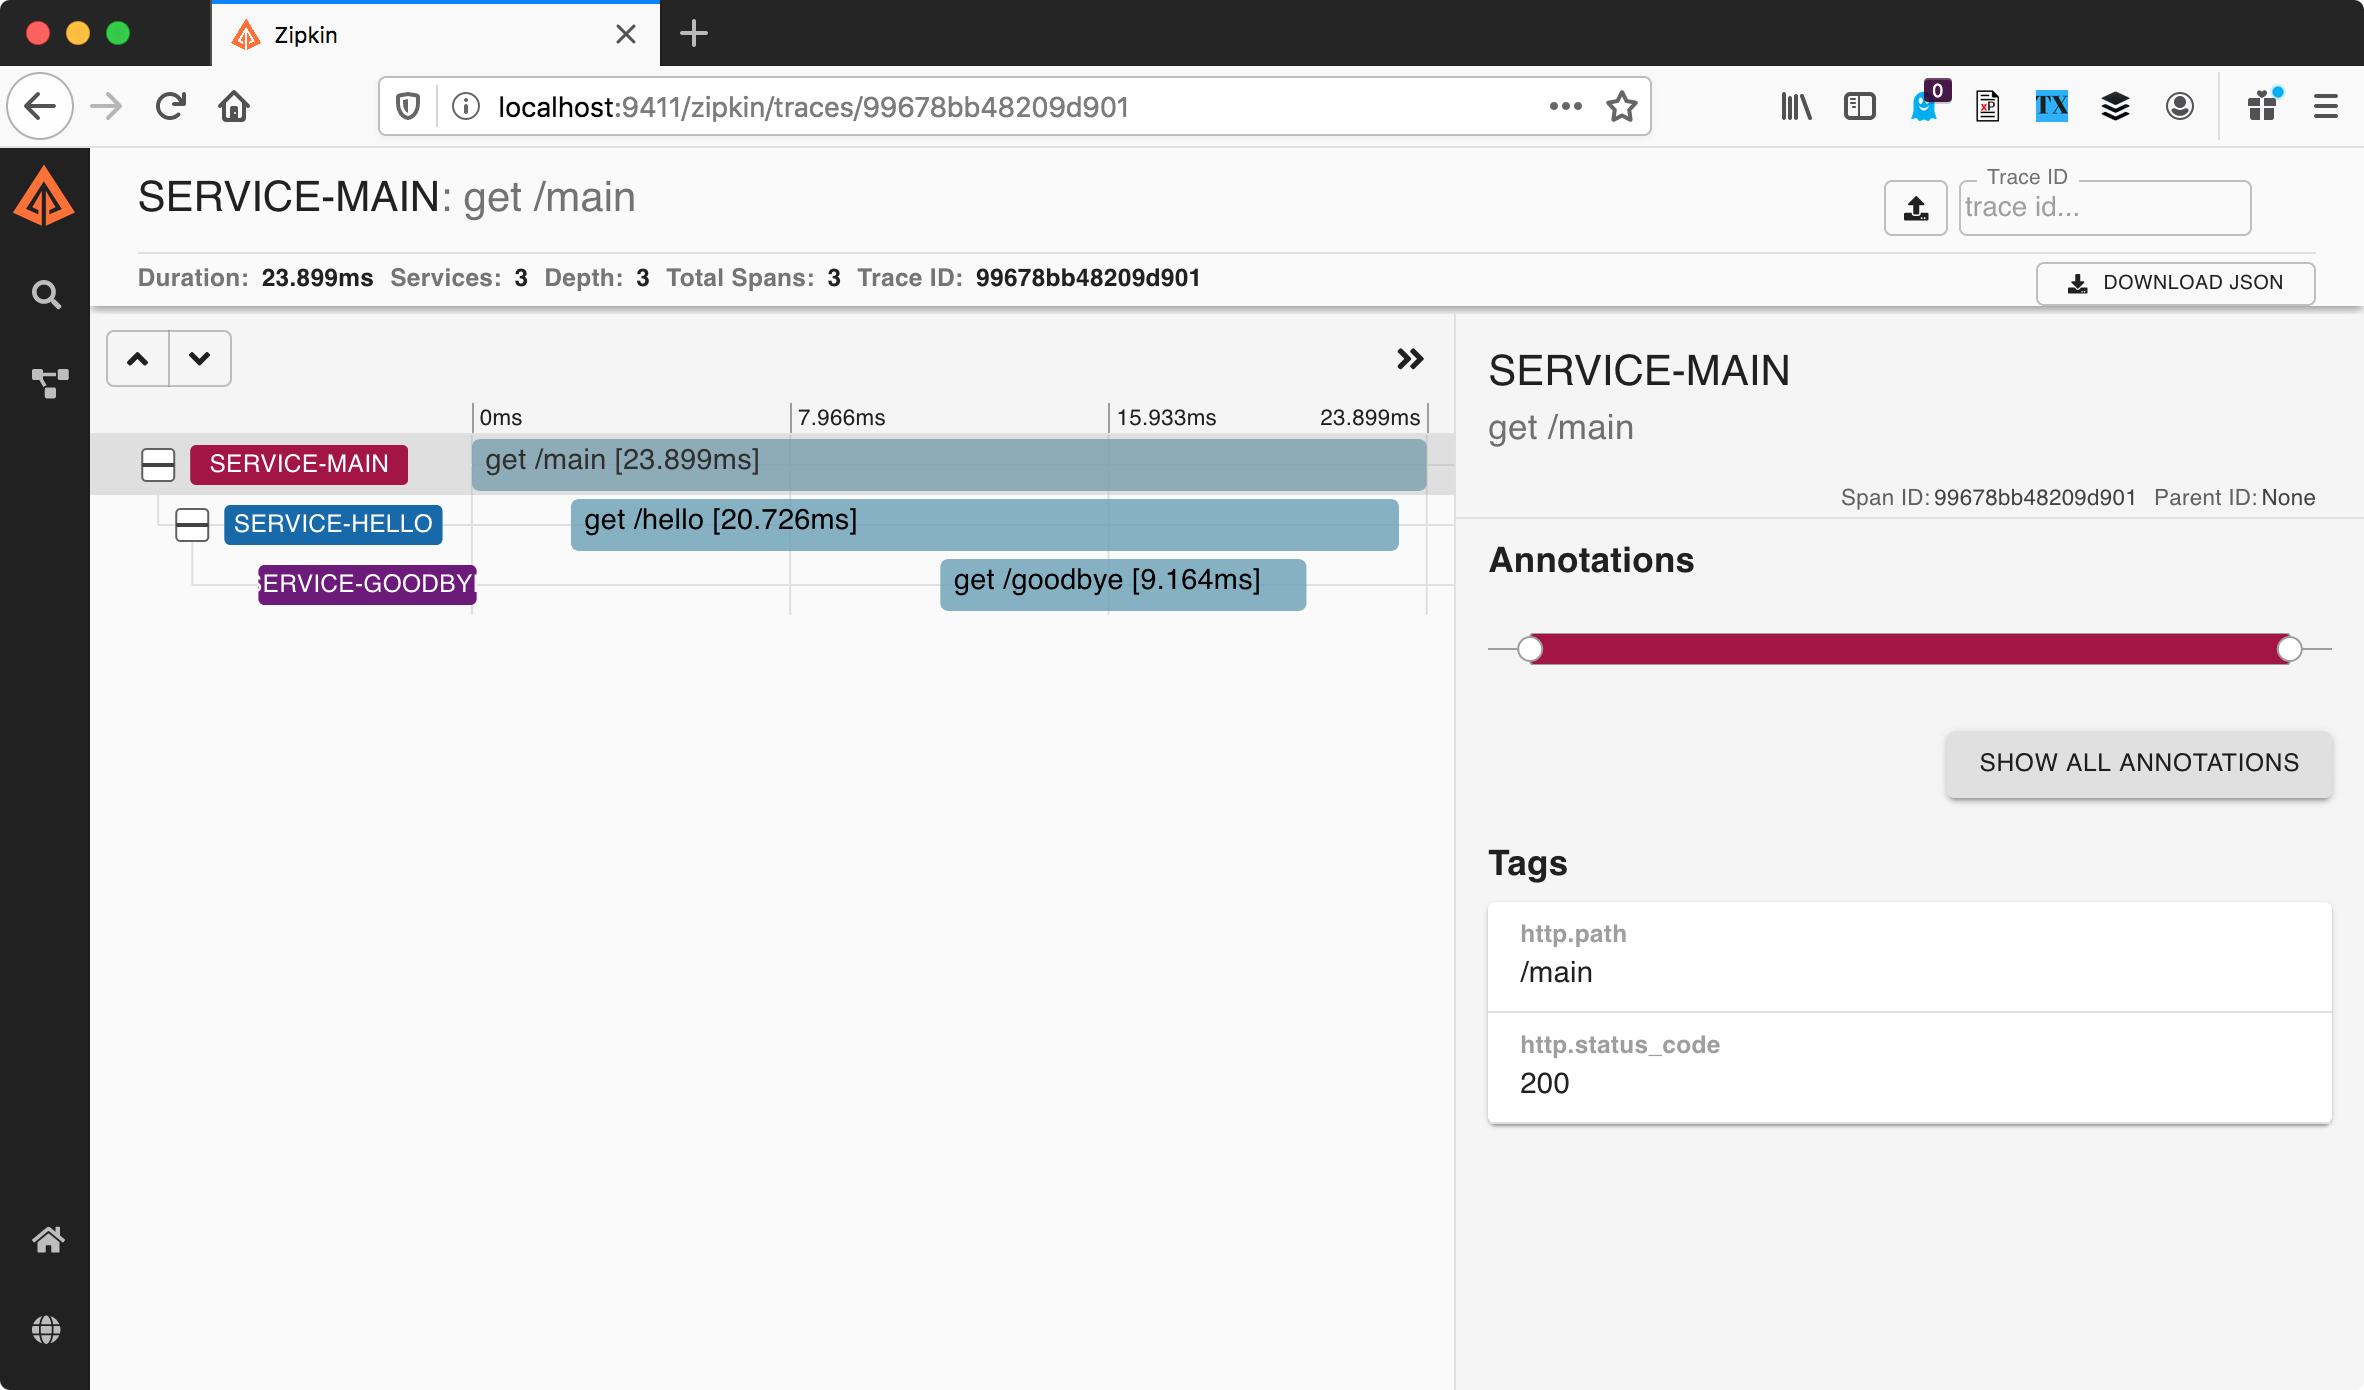
We get a tree view of the trace. That is, this chart shows that the request to /goodbye is the result of the request to /hello, which is the result of the request to /main. This is what we meant when we said a trace, in addition to timing things, also keeps track of how these things are related to one another.
Also — it’s time we stopped calling the things we’re measuring “things”. In a trace, each individual “thing” we’re measuring is called a span. That’s span as in “a span of time”.
Wrap Up
We’ll leave it there for today. Now that we’ve seen what a service instrumented with Zipkin looks like, next time we’ll take a deeper look at Zipkin’s model and how we’ve used Zipkin libraries to trace these services.