
- What is Prometheus?
- What are Prometheus Exporters?
- What are OpenTelemetry Metrics and Exporters
In our first article, we covered four core Prometheus concepts and used those four concepts to instrument a simple service written in NodeJS. One part of the Prometheus ecosystem we didn’t talk about was exporters. That’s going to be our topic today.
However, before we get to exporters we need to talk a little bit more about instrumentation.
The Limits of Instrumentation
Under ideal circumstances, the best course of action for any monitoring situation is instrumentation that you and your team write specifically for your application, service, or system, and instrumentation that you continue to update as you learn more about what sort of metrics your system needs.
We all know what the phrase under ideal circumstances means in a technical article.
Justifying upfront and ongoing custom instrumentation is a difficult proposition in most real-world software situations. Even when a system has become important enough to instrument, its original engineers are often long gone, and with them the knowledge of the best places for that instrumentation to live.
Even in organizations with a strong engineering culture, the parts of an organization that want to instrument a system are often not the parts of an organization that write code for that system.
Even putting aside cultural/business problems — most of our systems today include open source systems software (think apache, nginx, haproxy, etc.) It’s increasingly rare for organizations to compile this software themselves or to have experts on hands who could use an instrumentation library to directly instrument this open source software. It’s also hard to convince the owners or maintainers of this software to use a specific instrumentation library. Many of these systems do have some form of internal metrics or statistics, but they’re based on home grown data models and implementations.
This is why, despite having a solid set of instrumentation libraries, you won’t see a lot of software with built-in Prometheus instrumentation.
What you will see a lot of are Prometheus Exporters.
What is an Exporter
The name exporter is a bit misleading. When I think of an exporter, I think of a feature that a software developer builds into their system that will export the data into a stand-alone file. For example, a blogging system will often have an exporter that allows you to save all your posts to a single file that can be imported into other blogging system.
That’s not what a Prometheus Exporter is.
To start — remember the open source systems we mentioned? Many of them already have built-in metrics/statistics of some kind. For example, the apache web server has the mod_status module. This apache module allows apache users to create a (hopefully IP restricted) page that lists a bunch of useful statistics about their server.
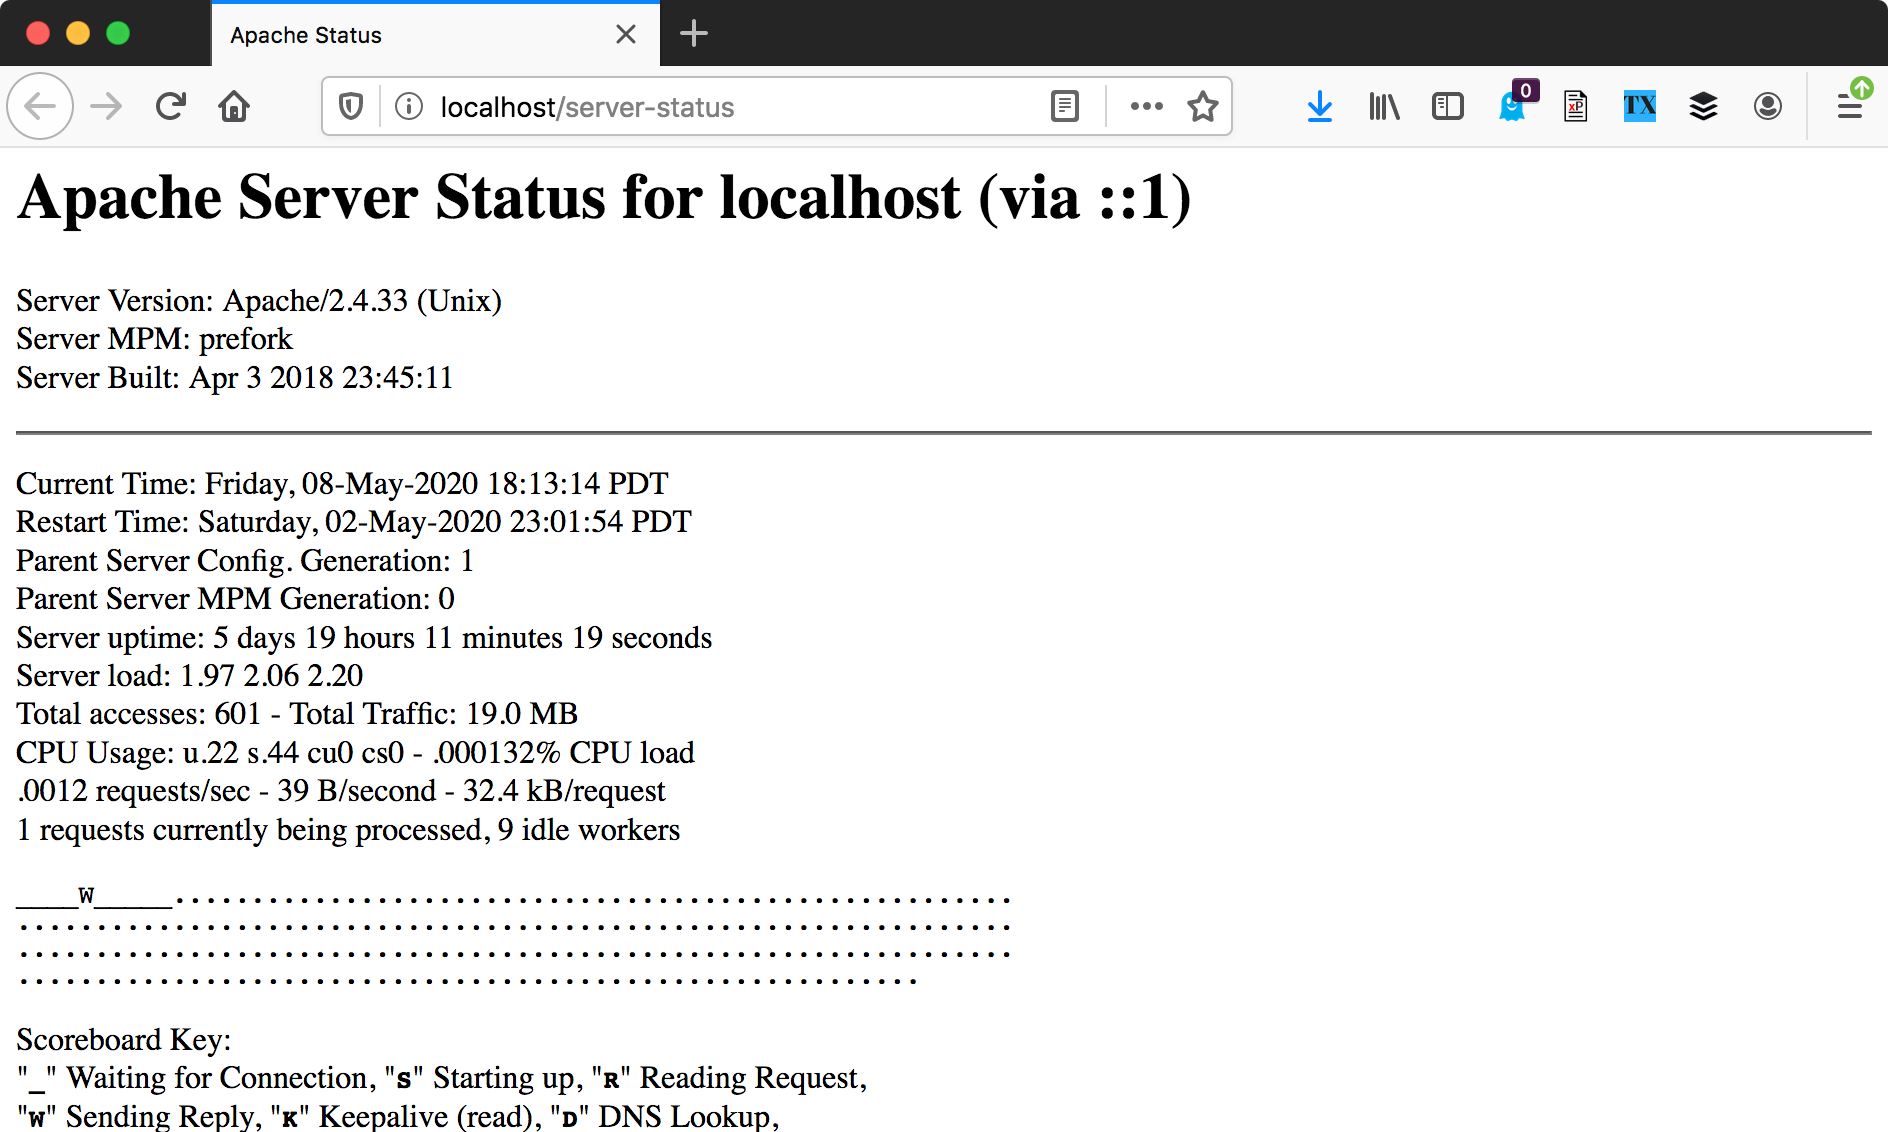
Apache doesn’t have a feature to “export” these statistics. Apache just displays the information. This is the problem that Prometheus Exporters solve.
A Prometheus Exporter is a piece of software that
- Can fetch statistics from another, non-Prometheus system
- Can turn those statistics into Prometheus metrics, using a client library
- Starts a web server that exposes a
/metricsURL, and have that URL display the system metrics
To a non-programmer, a Prometheus Exporter seems to allow you to export statistics from a non-Prometheus system and import them to Prometheus. To a programmer, a Prometheus Exporter is really more like a content scraper that converts metrics from one format to another.
Whatever you want to call them, these exporters are where Prometheus’s real value starts to show. If you take a look at the exporters page there’s over 160 exporters for common systems software. The vast majority of these exporters are provided by third parties as open source software.
With these exporters in hand, site reliability engineers (or, you know, Linda — the one who always gets the site back up after Frank crashes it) don’t need anyone to write instrumentation for them. They can import the statistics provided by the software they’re using right into Prometheus.
Anatomy of an Exporter
Remember the mod_status module we mentioned for apache? Well, there’s a Prometheus exporter for it. You can write an exporter in any language you like — this apache_exporter is written in golang.
This exporter is a program that fetches and parses the apache /server-stats page and then uses the Prometheus go library to create and record metrics based on the data types found on that stats page,
We’re not going to run through getting this exporter running and configuring a Prometheus instance to scrape its /metrics URL — asking you’all to compile a golang program and get an apache server running and configure mod_status seems like a big ask for an intro tutorial. We do recommend finding a piece of systems software you use and seeing if you can get an exporter up and running. The real power in Prometheus is with these exporters.
Open Lock In
Before we finish for today, there’s one last thing to consider when looking at Prometheus. Prometheus is open source software and as we learned today, a huge amount of the value Prometheus provides is based on open source software written using Prometheus libraries. However, once you’ve decided to use Prometheus you’re locked-in to their world. Leaving Prometheus would mean abandoning any custom instrumentation you’ve written, as well as hoping you find something to replace the exporters you’re relying on.
For some folks this is an acceptable trade off. If it’s not an acceptable trade-off for you, you may be interested in the OpenTelemetry project. We all know the joke about one more standard — but OpenTelemetry takes an interesting approach to instrumentation that could provide a universal language for writing instrumentation that’s exportable to any system.
Next time, in the final article of this series, we’ll take a look at OpenTelemetry’s metrics libraries.